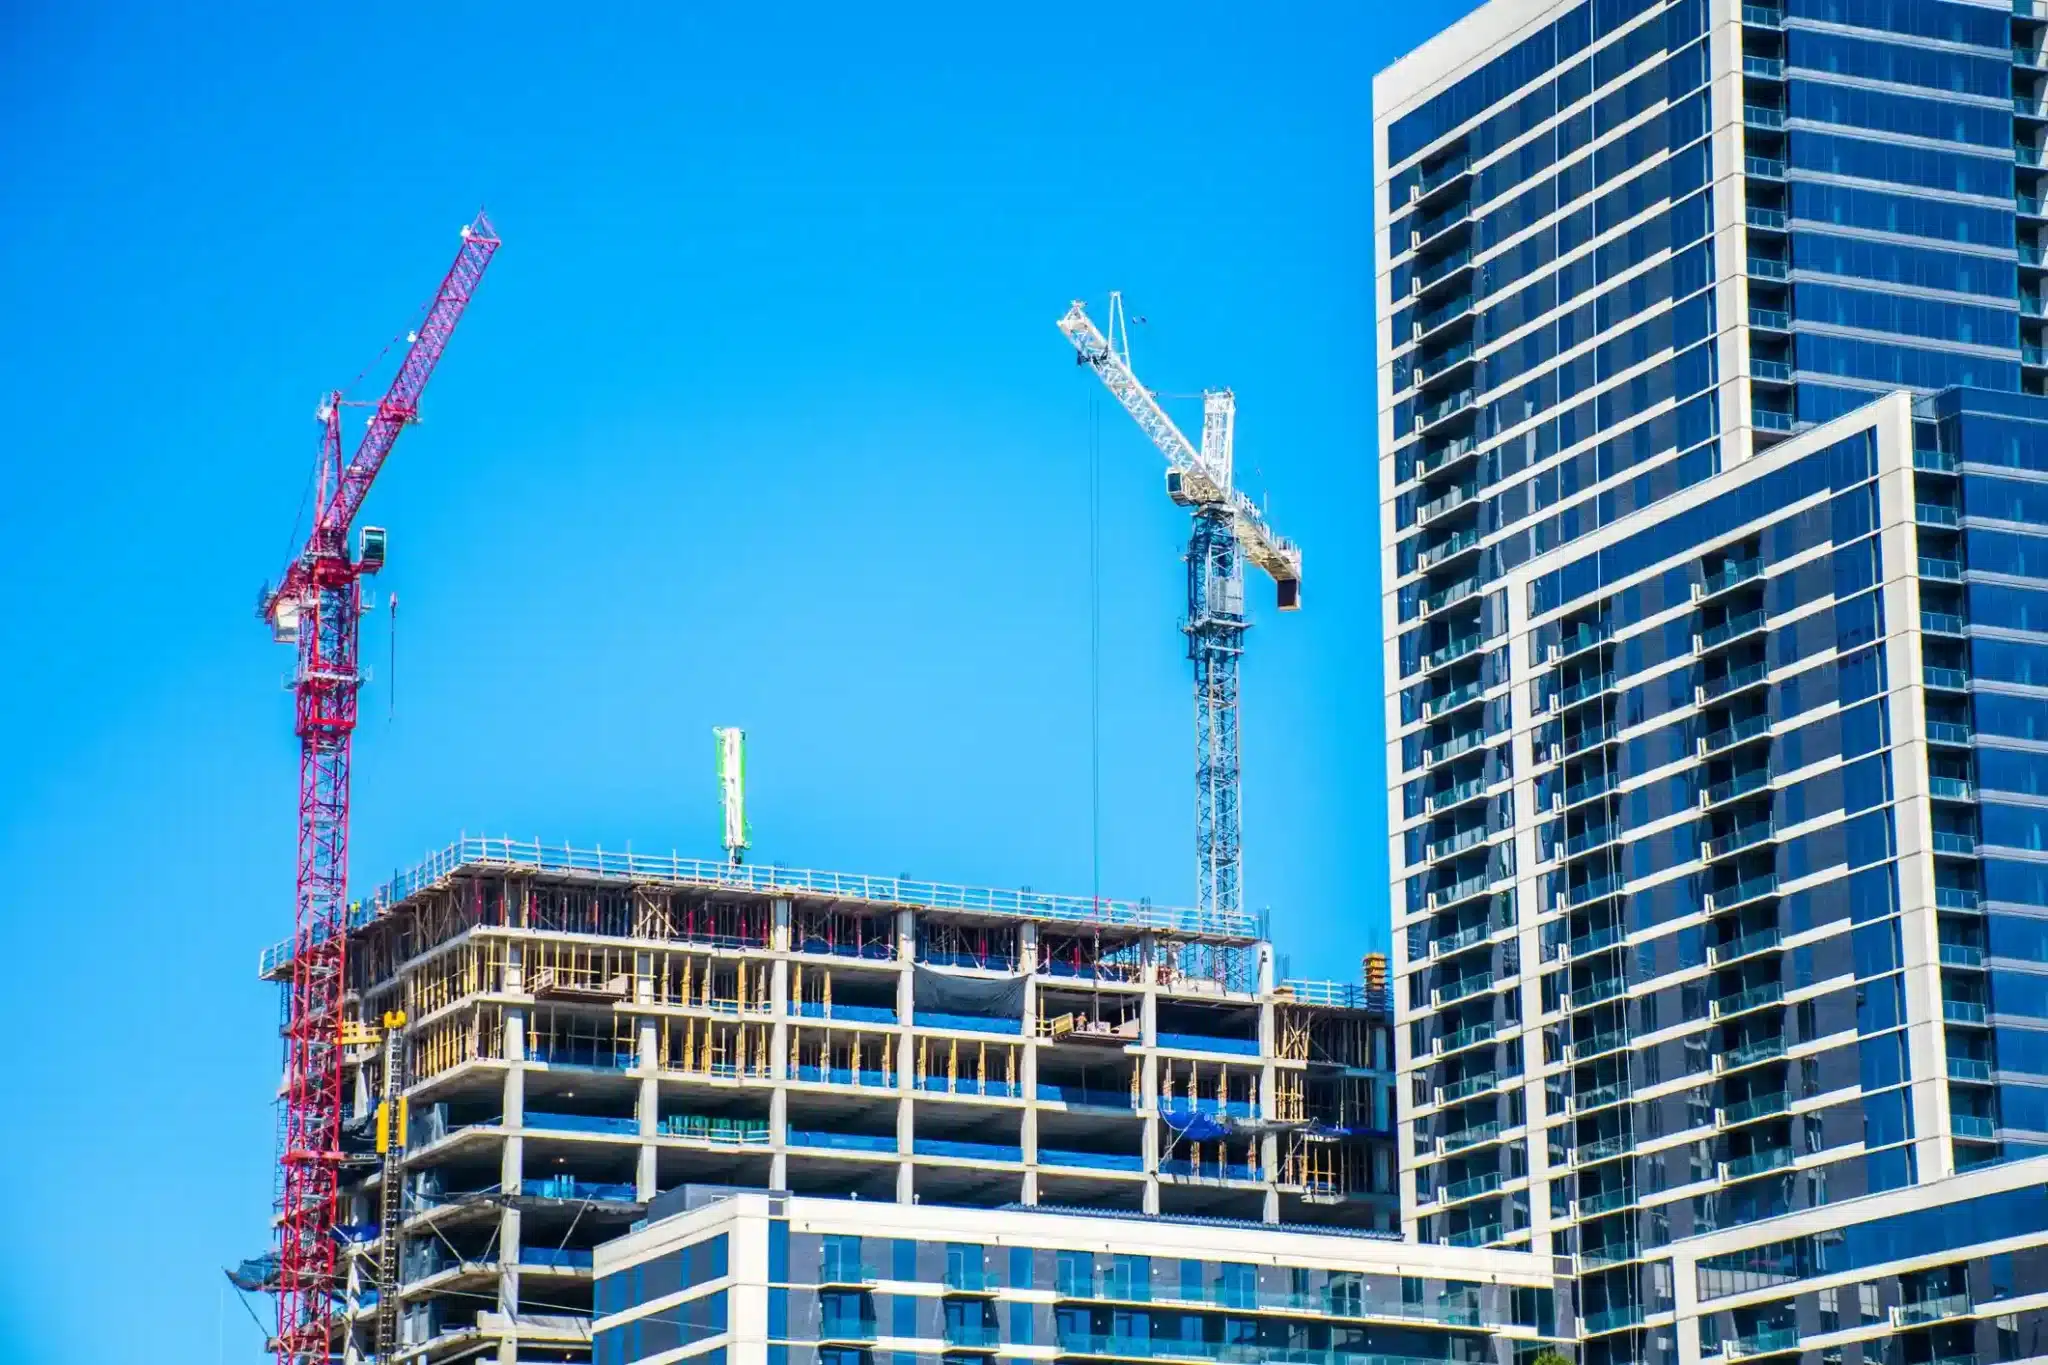
Real estate development financial model
Why does real estate development need a different financial model?
A developer does not sell a continuous flow of products: it sells a project that takes three or four years and books almost all of its revenue in the months when the homes are conveyed. For most of the cycle it spends without invoicing, funds itself with debt and customer deposits, and builds up an inventory balance that grows month after month. Treating a development like an industrial company fails on the essentials: the income statement does not reflect the activity, and the balance sheet is the real dashboard.
In our corporate financial advisory practice at Maraz Corporate Finance we build these models for mid-market developers that need to negotiate financing, prepare a corporate transaction or run the company with a 24-month cash view. This article walks through every component of the model with a 60-unit illustrative case that runs all the way to the sensitivity analysis at the end.
Gross built area and net sellable area: the conversion that sets the margin
Costs accrue per square metre built and revenue is earned per square metre sold, and they are not the same area.
The gross built area is what defines the site's buildable rights and what the contractor prices: the homes, the common areas (lobbies, staircases, plant rooms) and, separately, the below-grade area for parking and storage.
The net sellable area is what appears in the contracts: in Spain, homes are sold on built area with a pro-rata share of common areas, while parking spaces and storage rooms are sold as units, not per square metre. Between the two sits the efficiency ratio (sellable over above-grade built area), which in residential blocks runs between 0.80 and 0.90. Below grade is worse: a parking space costs €400-600 per square metre built, requires basements with foundations and retaining walls, and sells for less than it costs. Planning rules require them; the model must treat them as a cost of the homes, not as a business line.
Illustrative case: 60 homes with 6,000 m² sellable, 7,200 m² built above grade (efficiency 0.83) and 2,400 m² below grade. Average price of €3,000 per sellable square metre including ancillary units: sales of €18.0m. Land €4.5m (€750 per sellable square metre, 25% of price), construction €8.4m (€1,000 above grade and €500 below grade), professional fees, permits and structural insurance €0.9m, marketing €0.45m, finance costs €0.45m, after-sales €0.1m and other €0.2m: total cost €15.0m and margin €3.0m, 16.7% on sales and 20% on cost.
Note that the €8.4m of construction equals €1,400 per sellable square metre, 40% more than the €1,000 per built square metre negotiated with the contractor. That gap is exactly what a model that mixes the two areas fails to see.
Drivers of the real estate development business
Few variables move the result:
- Sales price per sellable square metre. The dominant driver: it applies to the entire sellable area and carries no associated cost. It must be segmented by unit type, floor, orientation and ancillary units.
- Land cost and land cost per sellable square metre. Paid upfront, with no certainty on sales or financing, and impossible to correct later. It includes taxes, brokerage and, if the site is not fully entitled, the planning process. In tight markets it exceeds 40% of the final price.
- Construction cost per built square metre, plus professional fees, permits, project monitoring, marketing, structural insurance and finance costs. It is the line with the most inflation since 2021 and the reason to insist on a fixed-price contract.
- Area efficiency: the ratio between what is built and what is charged for.
- Pre-sales pace and construction schedule. They determine how long capital stays locked in, when the bank's conditions are met and how much it costs to finance the project.
- Capital structure. The mix of equity, customer deposits and developer loan defines leverage and multiplies the return on capital in both directions.
The model is the orderly translation of these drivers into a calendar of receipts, payments, revenue and expenses.
How to build the projections
The model is monthly and project by project, never aggregated: the company is the sum of its live developments plus overheads.
The backbone is the milestone calendar: land purchase, building permit, start of marketing, loan signing, start and completion of construction, first occupancy licence and conveyancing. The full cycle usually runs 30-42 months (12-18 for permits and pre-sales, 18-24 of construction) and each milestone triggers different flows: without a permit there are no guaranteed pre-sales or drawdowns; without construction there are no certifications; without the first occupancy licence there is no conveyancing and no revenue.
Four curves overlay that calendar: sales (units per month, with a launch peak, a trough during construction and a final uptick, distinguishing reservation, private contract and deed); receipts (reservation, 10% at contract, instalments up to 15-30% during construction and the balance at the deed); construction (an S-curve, with less certified in foundations and finishes than in the middle stretch; a straight-line split understates the cash need); and soft costs (fees upfront, permits, marketing in proportion to sales, structural insurance and finance costs).
Revenue and expense recognition
Revenue is recognised when control of the property is transferred: at the notarial deed, or at handover of keys if earlier. Until then there is no accounting sale, however many private contracts and deposits there may be. The sector adaptation of Spanish GAAP (PGC) and the doctrine of the accounting regulator (ICAC) rule out percentage-of-completion for home sales: the developer is not providing a construction service on an asset the customer controls; it is selling a finished good.
Customer deposits are a liability (customer advances, account 438) and the homes remain in inventories until the deed, when revenue (700) and cost of sales (610) are recognised at the same time. The whole development's margin surfaces concentrated in the delivery months.
Expenses follow different logics: costs attributable to the development (land, site works, construction, fees, permits, structural insurance, technical control body) are capitalised into inventories; finance costs on the loan are capitalised while construction is in progress; marketing costs are never capitalised and depress the early years; overheads are a current expense.
Capitalising finance costs into inventories is not an option; it is the rule.
Recognition and Measurement Standard (NRV) 10 of the PGC (Royal Decree 1514/2007), paragraph 1.1, provides that for inventories that need more than a year to be ready for sale, finance costs are included in cost "under the terms set out in the standard on property, plant and equipment"; that standard, NRV 2, paragraph 1, specifies that interest accrued before the asset is ready for sale is capitalised, whether from specific financing (the developer loan) or from directly attributable general financing.
The ICAC Resolution of 14 April 2015 on the determination of production cost (Rule Four, finance costs) sets the mechanics: specific financing is allocated first, general financing is capitalised at the weighted average rate capped at the interest actually accrued, capitalisation starts with the first disbursements and technical activity, and it is suspended if construction is significantly halted.
The sector accounting rules for real estate companies (Ministerial Order of 28 December 1994, as amended by the Order of 11 May 2001), still in force where they do not conflict with the 2007 PGC, apply this expressly to developments in progress until construction is complete, and the international equivalent is IAS 23.
Three consequences for the model: accrued interest is capitalised, not the arrangement fee, which flows through the effective interest rate; capitalisation ends with the certificate of completion, so interest between completion and conveyancing, and any interest from a delayed first occupancy licence, goes straight to the income statement; and a halted site stops capitalising even though the loan keeps accruing.
Corporate income tax follows the accounting treatment: the profit is taxed in the year of conveyancing, with heavy instalment payments that year.
Developments in progress as inventories
Developments are neither fixed assets nor investment property: they are inventories (NRV 10 of the PGC), because they are held for sale. The sector adaptation distinguishes three sub-accounts that banks and auditors analyse separately:
| Sub-account | Content | Timing |
|---|---|---|
| Land and plots | Land plus inherent costs (notary, registry, transfer tax or non-deductible VAT) | Until the development starts |
| Developments in progress (group 33) | Land, certified works, fees, permits, insurance and capitalised interest | From start of construction to certificate of completion |
| Completed buildings (group 35) | Balance of group 33 transferred in full on the certificate of completion; finished units not yet conveyed | From completion to the deed |
Total cost is allocated across sellable units with a consistent criterion, normally in proportion to expected sales value, which prevents parking and storage units from showing artificial negative margins. While the development is in progress, each conveyed unit is derecognised at total forecast cost, not cost incurred to date, with the share of future costs booked as a provision; otherwise the first deliveries would show inflated margins and the last ones losses.
Two adjustments: impairment, when net realisable value (contract price for units sold, market price for the rest, less costs to complete) falls below cost, reversible if the market recovers, and something every downside scenario must test; and stockpiled materials and advances to suppliers certified but not executed, which must not inflate progress.
The developer's working capital
Current assets are almost entirely inventories; current liabilities are customer deposits and drawn debt; there are hardly any receivables. Four items need specific treatment.
Customer deposits. A liability with no explicit cost but with restrictions: the First Additional Provision of the Spanish Building Act (LOE) requires the developer to guarantee their repayment, with VAT and statutory interest, through a bank guarantee or surety insurance from the building permit onwards, and to deposit them in a special account that can only be used for the works; the guarantee is released at the first occupancy licence and the deed. The bank requires that account to be held with it, proof of the guarantee before authorising drawdowns, and usually applies the deposits to reduce the loan.
VAT. 21% is incurred on land and fees (construction is subject to the reverse charge) and 10% is charged on homes and 21% on commercial units. During construction a VAT receivable builds up that the bank does not finance and that is only recovered at conveyancing or through the annual refund. VAT on each deposit accrues when it is collected and is paid in that period's return.
Suppliers. The contractor certifies monthly and is paid at 30-60 days; retention money (5-10%) is released after handover and pushes cash outflows to the end.
Operating working capital (inventories less deposits less payables) grows during construction and converts into cash at conveyancing. Its peak, net of the developer loan, is the equity the development really needs.
The developer loan: how it works in detail
It is a purpose-specific mortgage loan to the development company, secured on the land and the future building, drawn as construction progresses and repaid as the homes are conveyed: a structure halfway between corporate financing and project finance. It must be modelled as a complete sub-model, not as a percentage of cost.
Loan size and leverage
The bank sizes the loan on the most restrictive of three ratios: loan to cost (65-75% of cost for developers with a track record, 50-65% for first-timers or secondary locations), loan to value on the appraised value of the completed development (normally between 60% and 75%) and loan to GDV, debt over gross development value, below 50-60%. These are typical ranges, not rules; each term sheet sets them. In full refurbishments the LTC drops to 60-70% because of cost-overrun risk, and debt funds go up to 75-80%, but always on cost, never on GDV.
Drawdown and phases
Signing is conditional on the building permit, the committed equity and a minimum level of pre-sales (30-50% of units or of sales volume, with private contracts and deposits paid), which today is the single most decisive variable for obtaining financing. The sequence: equity for land and design, permit, pre-sales, signing of the mortgage with a possible kick-off tranche (around 10%), monthly drawdowns against work certifications validated by the appraiser or an independent project monitor that audits the works and invoices, a final retention of 5-10% until the certificate of completion and first occupancy licence, and extinction unit by unit at conveyancing; 30-60 days elapse between certification, drawdown and payment.
In the model, the monthly drawdown is the minimum of four limits: undrawn commitment, certified eligible costs times the agreed percentage, actual cash need after applying deposits, and the balance that respects the covenants. The funding mode should also be parameterised, equity first (all equity before the first drawdown) or pro rata, because it changes peak debt, interest and equity IRR.
Grace period, interest and fees
During construction only interest is paid on the drawn balance, at Euribor (3 or 12 months) plus 1.5-3.0 points, which with today's Euribor puts the rate between 4.5% and 6.5%. Add arrangement (0.5-1.5%), study (0.2-0.5%), drawdown (0.1-0.3%) and commitment fees (0.3-0.5% a year on the undrawn amount), plus appraisal and the deposit guarantee. Because the balance follows the construction curve, the cost is computed month by month; over 24 months of construction the average balance is around 45-55% of the facility. The grace period is usually 24-36 months plus 6-12 to convey, and on long projects a cap or swap on the drawdown schedule is worth considering.
Keep three views of the finance cost: cash (what is paid to the bank), accounting (expense at the effective interest rate, which spreads the arrangement fee over the life of the loan) and inventories (the share capitalised during construction). With only the first you get the balance sheet and margin wrong; with only the second you cannot negotiate with the bank.
Subrogation and unit-by-unit release
The mortgage is allocated across the units of the horizontal division, with a mortgage liability per home, parking space and storage room. At the deed, the buyer either subrogates into the portion secured on their home (the developer collects the difference and the bank converts developer debt into a retail mortgage) or finances elsewhere, in which case the developer releases that unit's liability with the proceeds plus an additional percentage (sweep) that accelerates repayment. In the first deeds almost the entire price goes to repayment; free cash appears when the outstanding balance falls below the liability of the remaining units. In cash terms, the margin is collected in the last third of deliveries.
Covenants
The usual covenants are periodic reporting, LTC and LTV, minimum pre-sales, dividend restrictions and acceleration for cost or schedule deviations. During construction the most useful test is not the DSCR, meaningless while there are no deeds, but cost-to-complete coverage: cash plus undrawn loan plus pending equity, divided by the cost still to come. Below 1.0 there is a funding gap that shows up months before any other ratio flags it.
Alternative financing
When pre-sales fall short or the land is not financed, debt funds fill the gap:
| Parameter | Traditional banks | Debt funds |
|---|---|---|
| Maximum LTC | 65-75% | Up to 75-80% |
| Required pre-sales | 30-50% | Flexible or none |
| Cost | Euribor + 1.5-3.0% | 8-15% |
| Approval time | 6-12 weeks | 2-3 weeks |
| Additional security | Corporate or personal guarantees | Mortgage only |
| CIRBE (Bank of Spain credit register) | Reported | Not reported |
The hybrid structure is increasingly common: a fund for land and kick-off, then refinancing with a bank once pre-sales are reached. The model carries that debt at its real cost and with the constraint that it is repaid with the developer loan, not with the deeds.
Capital structure: how much equity is needed and what leverage does to IRR
Sources of funding for a development
With the limits above (LTC 60-75%, LTV 60-75% and loan to GDV below 50-60%, the most restrictive of the three), Spanish banks never finance 100% of a development. The developer has to cover between 25% and 40% of total cost with equity, and in practice that tranche is the land: banks finance construction and soft costs but require the plot to be paid, or mostly paid, before the first drawdown. Customer deposits are the third source. In the illustrative case:
| Source | Amount | Share of total cost | When it comes in |
|---|---|---|---|
| Developer equity | €5.5m | 37% | Land, design and permits; before the first drawdown |
| Customer deposits up to the deed | €2.5m (14% of sales) | 17% | Reservation, contract and instalments during construction |
| Developer loan (€10m facility, peak drawn ~€7m) | €7.0m | 46% | Against work certifications |
Customer deposits as a source of financing
Every 10% of the price that buyers pay before the deed is, in the example, €1.8m that does not have to be drawn on the loan: about €100,000 less in interest and, if the bank counts them as funds contributed, less equity required. The earlier the contracts are signed, the more construction is financed at zero cost. The trade-off: guarantee costs, restriction to the works and repayment with statutory interest if the development fails. In the model they are financing, not free cash.
Land-for-build swap (permuta)
A very common variant in Spain is the permuta: the landowner contributes the plot in exchange for a share of the finished building, usually between 20% and 35% of sales value. It removes the main upfront outlay and sends equity IRR soaring, but it requires specific treatment: the land enters inventories at the value of the units to be delivered, with a liability (advance in kind) that is cancelled on delivery
VAT on both transfers accrues at the swap; the committed units count neither as sales nor as pre-sales for the bank, which will require the plot to be mortgaged free of the landowner's charge and the in-kind consideration to be guaranteed under the LOE. In the illustrative case, a 25% swap cuts equity from €5.5m to about €1.5m and cash sales to €13.5m: less margin in euros, much higher IRR and more execution risk, because the landowner receives product before the developer collects its profit.
Leverage, IRR and ROE
The leverage effect multiplies the return on equity as long as the cost of debt is below the project return, and multiplies the loss when it is not. On the illustrative case, at base price and with a 10% price drop:
| Structure | Equity | Interest | Base margin | Multiple | Base equity IRR | IRR at price −10% |
|---|---|---|---|---|---|---|
| No debt | €15.0m | 0 | €3.45m | 1.23x | 7.1% | 3.5% |
| LTC 67% (base case) | €5.5m | €0.45m | €3.00m | 1.55x | 15.6% | 6.8% |
| LTC 75% with deposits applied | €4.0m | €0.55m | €2.90m | 1.73x | 19.9% | 8.4% |
Project ROE (margin over equity) goes from 23% with no debt to 55% in the base case and 73% at maximum leverage. What matters is not in the table: with €4m of equity, the combined downside scenario in the final section leaves the developer with no cushion, the covenants trip earlier, and the only way out is fresh equity, a refinancing or a discounted sale. Optimal leverage is not the maximum the bank will grant, but the level that keeps cost-to-complete coverage above 1.0 in the severe scenario.
After-sales, claims and ten-year structural insurance: what they cost
The Spanish Building Act (LOE) places three warranties on the developer: one year for finishes, three for habitability and ten for structural damage. After-sales service passes incidents on to the contractor and trades against retention money, but part of the cost always stays with the developer: retentions already released, defects with no clear culprit, the cost of handling claims and, at worst, litigation with owners' associations. Our estimate as a percentage of the construction contract value (PEC):
| Item | Term | % of PEC | Illustrative case (PEC €8.4m) |
|---|---|---|---|
| Snagging and finishes | 1 year | 0.3-0.6% | €25,000-50,000 |
| Habitability and building services | 3 years | 0.2-0.5% | €17,000-42,000 |
| Claims handling | 1-3 years | 0.2-0.4% | €17,000-34,000 |
| Recommended total provision | 0.8-1.5% | €70,000-125,000 | |
| Ten-year structural insurance plus technical control body (contractual cost, separate) | 10 years | 0.6-1.0% | €50,000-85,000 |
The provision equals 0.4-0.7% of sales, €1,200-2,100 per home; after-sales and structural insurance together run around 1.5-2.5% of PEC. Structural damage is covered by the insurance, not the provision. These are starting benchmarks: a company with a track record should use its actual claims history by unit type and contractor.
The provision is booked at each unit's deed (expense on delivery) and used as repairs are made (cash deferred 12-36 months). The ten-year structural insurance is a separate contractual cost: mandatory to sell new-build homes, it requires a technical control body (OCT) from the start of construction, and without the final policy the land registrar will not register the completed building and no deeds can be signed. It is a milestone in the calendar, and neither replaces the other.
Risk analysis
Each risk needs a hypothesis that can be stressed and a mitigation built into the deal.
| Risk | Model variable | Usual mitigation |
|---|---|---|
| Commercial: slow sales, discounts | Sales curve, price | Pre-sales threshold before starting construction |
| Construction: inflation, change orders | Cost per m², contingency | Fixed price; 5-10% contingency |
| Schedule: permits, works, first occupancy | Milestone calendar | Grace period with headroom; penalties |
| Financial: rates, no loan, bridge debt | Euribor, margin, signing date | Hedging; no bridge without an exit |
| Planning: permit, charges, appeals | Permit date, site works | Due diligence; conditional purchase |
| After-sales: defects, structural | Provision | OCT, structural insurance, retentions |
The risks are correlated (high rates, fewer sales, more pressure on price) and scenarios must combine them. Time multiplies all of them: every extra month adds interest, overheads, buyer withdrawals and market exposure, and a delayed first occupancy licence pushes interest straight to the income statement. The base, downside and severe scenarios must show margin, IRR, peak debt against the facility and additional equity required.
The Spanish market (October 2026)
- Macro and rates. The Bank of Spain raised its growth forecast to 2.6% for 2026 and 2.2% for 2027, and inflation to 3.9% and 3.7%, driven by energy. The ECB raised rates in June for the first time in almost three years, the market is pricing further hikes, and 12-month Euribor has moved from 2.2% in February to 3.25% in September.
- Supply and demand. Building permits closed 2025 at around 139,000 homes and are growing strongly, but the cumulative shortfall since 2021 is estimated at 600,000-750,000 homes. The national statistics office (INE) recorded 61,417 home sales in July, down 5.1% year on year and 3% year to date; new-build sales fell only 1.4%. The market is polarised: Madrid, the Balearics and the Mediterranean coast concentrate the pressure, and in Alicante or Málaga foreign buyers account for between a quarter and a third of purchases.
- Prices and costs. The INE house price index rose 12.2% year on year in the second quarter; new-build prices rose 7.4%, 1.7 points less than the previous quarter and only 1.0% quarter on quarter: new build no longer leads the increases, and the model's price must be built from local comparables with correction scenarios. Sociedad de Tasación puts the construction cost of developments started at €1,451/m², up 11.2% year on year and an all-time high.
- Financing. Investment in development (€35bn in 2024) is projected above €50bn by 2030; banks are financing developments with pre-sales and contributed land as normal, and funds are gaining share in land and bridge financing.
Sensitivity to the main drivers
On the illustrative case (sales €18m, cost €15m, margin €3m, equity €5.5m, loan €10m, 36 months), pre-tax equity IRR is 15.6%. The table moves each driver separately, ranked by impact:
| Driver and deviation | Margin (€m) | On sales | Equity IRR |
|---|---|---|---|
| Base case | 3.00 | 16.7% | 15.6% |
| Price −10% | 1.20 | 7.4% | 6.8% |
| Price −5% | 2.10 | 12.3% | 11.4% |
| Construction cost +10% | 2.16 | 12.0% | 11.7% |
| Sellable/built efficiency −3 points | 2.28 | 13.2% | 12.3% |
| Sales 30% slower (6 months and 2% discount) | 2.39 | 13.3% | 10.9% |
| 12-month delay | 2.50 | 13.9% | 9.8% |
| Land +10% | 2.55 | 14.2% | 12.6% |
| 6-month delay | 2.75 | 15.3% | 12.3% |
| Euribor +100 bp | 2.90 | 16.1% | 15.2% |
| Combined: price −10%, cost +10%, 6 months | 0.11 | 0.6% | 0.6% |
Four readings. Price rules: a 10% drop takes 60% of the margin, and the break-even price is only 16.7% below market. Construction cost is the second driver; the overrun that wipes out the margin is 36%, distant unless it coincides with a price fall. Time hurts IRR more than margin because it stretches the investment; that is why a slow sales pace weighs as much as a 10% cost overrun. And interest rates, little sensitive on their own, accompany all the others.
The combined scenario, with moderate individual deviations, leaves the margin at zero. On large developments, a Monte Carlo simulation on these drivers replaces the table with a distribution of outcomes.
Conclusion
Modelling a development means modelling a balance sheet that inflates and empties over three or four years: inventories hold the capital at risk; the developer loan, the deposits and, where applicable, the land swap finance it under strict rules; and the income statement only tells the story at the end. Whoever builds the model from cash and the balance sheet, with sellable and built areas properly separated and leverage calibrated to the severe scenario, has a tool to negotiate with the bank, convince an investor and run the company.
At Maraz Corporate Finance we build development models for developers, family offices and investors: review of assumptions against comparables, structuring and negotiation of the developer loan and of alternative financing, analysis of land swaps and equity partner entries, and preparation of the company or the development portfolio for due diligence and a corporate transaction. If you have a development under study or a financing to negotiate, let's talk: an independent review of the model before buying the land or signing the loan is the most profitable decision of the whole project.
Javier de Rojas Roca de Togores
Partner - Maraz Corporate Finance
FAQs about Real Estate Development financial model
When is revenue recognised on a home sold off-plan?
At the notarial deed, when control of the property is transferred. Private contracts and deposits are not sales: the deposit is a liability and the home stays in inventories until delivery. Percentage-of-completion does not apply.
How much equity does a development need in Spain?
Between 25% and 40% of total cost, in practice the land plus design and permits. Banks finance 60-75% of cost and require the plot to be paid before the first drawdown; customer deposits reduce the debt drawn.
What level of pre-sales does the bank require to sign the developer loan?
Between 30% and 50% of units or of sales volume, with private contracts and deposits paid. Units committed in a land swap do not count. Below that threshold, the alternative is debt-fund financing until it is reached, then refinancing with a bank.
How much should be provisioned for after-sales and claims?
Between 0.8% and 1.5% of the construction contract value (0.4-0.7% of sales), booked at each deed and used over one to three years. The ten-year structural insurance is a separate cost (0.6-1% of construction cost including the technical control body).
How much does a rate rise affect a development's profitability?
Directly, little: each point of Euribor costs about half a point of margin on sales. Indirectly, a lot: each point of mortgage rate cuts buyers' purchasing capacity by 8-10%, slows pre-sales and lengthens the schedule.